Your Dashboard: Stats, Trends, and Usage at a Glance
Learn how to read your Dashboard's stat cards, call usage progress bar, analytics charts, and recent call history.
Last updated July 6, 2026
What Is the Dashboard?
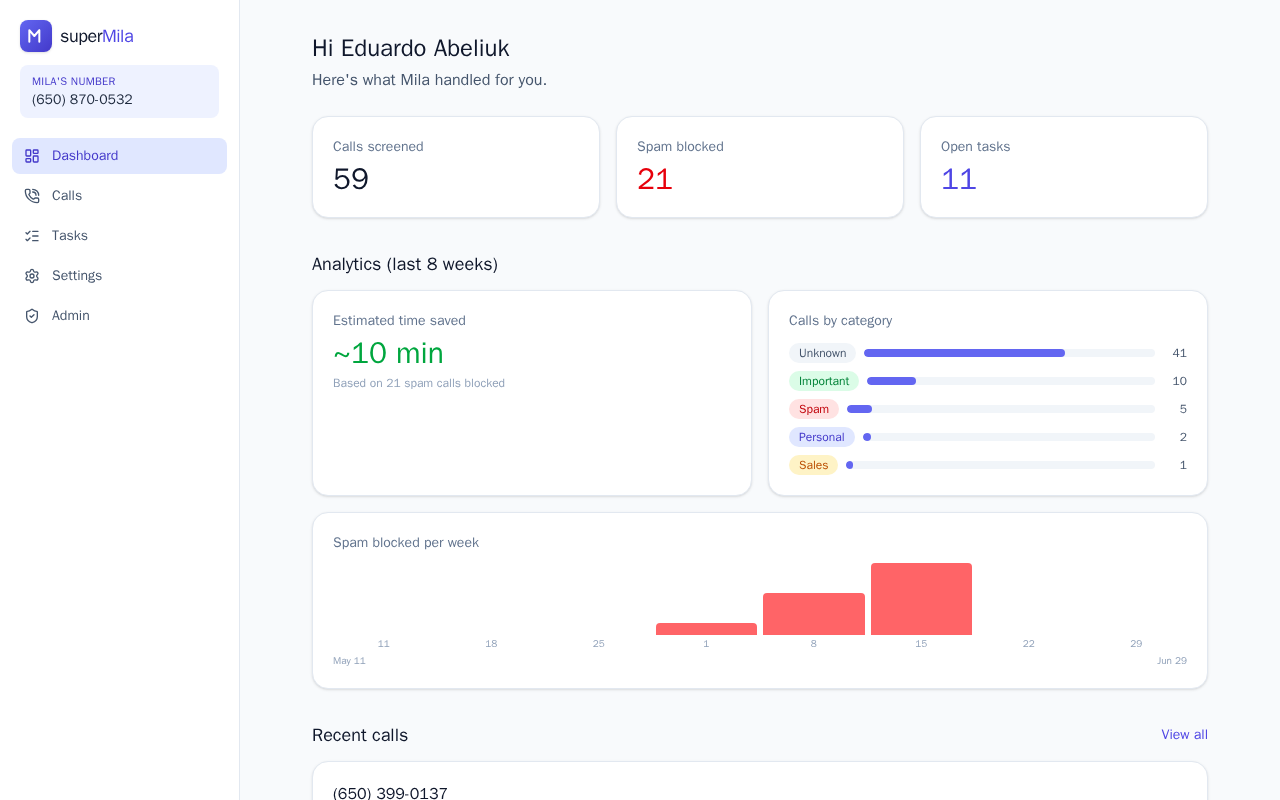
The Dashboard is your home screen — the first thing you see when you open the app. It gives you a personalized overview of your call protection, showing everything from high-level stats to recent activity, all in one place.
Your Key Stat Cards
At the top of the Dashboard you'll find three summary cards showing:
- Total calls screened — how many calls Mila has handled on your behalf.
- Spam calls blocked — the number of unwanted calls stopped before they reached you.
- Open tasks — any follow-up items still awaiting your attention.
These cards update automatically as new calls come in, so you always have a current snapshot.
Checking Your Call Usage and Plan Limits
If your plan includes a monthly call limit, you'll see a progress bar beneath the stat cards showing how many calls you've used so far this month compared to your allowance.
- Open the Dashboard from the main menu.
- Look for the Call Usage Alert section — this only appears if your plan has monthly call limits.
- Review the progress bar to see your usage at a glance.
- If you're approaching or have reached your limit, a colored alert will appear. Click the Upgrade to Pro link shown in that alert to move to a plan with a higher allowance.
If you don't see this section, your current plan either has no monthly cap or this feature isn't active for your account.
Exploring Your Call Analytics and Trends
Scroll down the Dashboard to find the Analytics section, which appears once you have call history. This section covers the past 8 weeks and includes:
- Estimated time saved — an at-a-glance figure showing how much time Mila has saved you by blocking spam.
- Calls by category — a visual breakdown using colored bars so you can see the mix of call types at a glance.
- Week-by-week spam trend chart — a bar chart showing how your spam volume has changed over time. Hover over any bar to see the exact count for that week.
Together these insights help you understand the level of protection Mila is providing and spot any changes in your call patterns.
Reviewing Recent Calls
At the bottom of the Dashboard you'll find a Recent Calls list showing your five most recent calls. For each call you can see:
- Caller name
- A short summary or reason for the call
- The call category
- Timestamp
To see your full call history, click the View all link at the bottom of this list.